
Thermo-Calc 2017b Available Now!

We are excited to announce the release of Thermo-Calc 2017b, which includes several new databases, major upgrades to the Diffusion and Precipitation modules and more:

Skärmbild 2020-12-30 053921

Thermo-Calc 2017b Includes Many Exciting New Features and Updates:

  • Several new databases
  • Many upgrades to the graphical mode Diffusion module (DICTRA)
  • New features in the Precipitation module (TC-PRISMA)
  • Six New Examples
  • 3D Plotting for Grid Calculations
  • Improvements to the Scheil calculator
  • Many bug fixes and usability improvements

New and Updated Databases

TCTI1: This is the first ever CALPHAD thermodynamic database which covers both Titanium-based alloys and Titanium Aluminium-based materials in a single database. The database consists of 23 elements, 236 assessed binary systems and more than 70 assessed titanium containing ternary systems. The database can also be employed to design light alloys based on the Al3Ti and AlTi3 intermetallic phases.

MOBTI2: The second edition of the titanium mobility database is designed specifically to be compatible with TCTI1.

TCNOBL1: A new thermodynamic database for noble and precious metal alloys which consists of 21 elements. The database can be applied to jewellery, decoration industries and dental alloys, as well as delicate components for scientific equipment, such as thermocouples and calorimetry elements.

TCAL5: The aluminium alloys database was expanded to include erbium, bringing it to a 35 element framework. The database includes 258 assessed binary systems and 87 assessed ternary systems. This update highlights the assessment of many binary and ternary systems relevant to the 8xxx and 8xx.x series of industrial aluminium alloys, including but not limited to Al-Ce, Al-Er, Al-Li, Al-Sc and Al-Sn alloys.

TCHEA2: The new version of the high entropy alloys database has improved stability descriptions of the sigma phase.

SSUB6: The sustance database has received general updates.

New Features in the Diffusion Module (DICTRA)

The graphical mode version of DICTRA, known as the Diffusion module, includes several new features that extend the functionality and flexibility of the program and make it more user friendly.

  • It is now possible to set boundary conditions.
  • One can now add a Table Renderer to the Diffusion Calculator.
  • A new advanced mode gives users more control over the plots and allows you to plot additional combinations, such as activity at a specific time. You can now also plot user-defined functions, giving you a lot of flexibility in the plotting.
  • All regions are now visible in the Configuration window. Small regions that would be too small to see are now represented with a dashed line, as shown in the image below.
  • A tool tip appears when you hover over a region which shows the name of the region, the width of the region and the number of grid points, as shown below.
Visable-regions

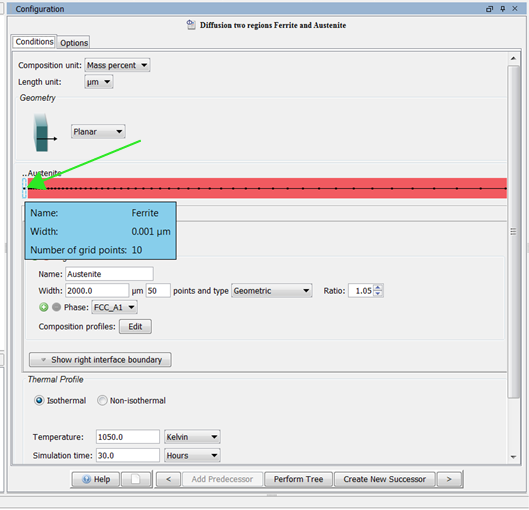
In the Diffusion module (DICTRA) small regions which were previously not shown are now visible with a dashed line. Additionally, a tool tip appears when you hover over a region which shows the name of the region, the width of the region and the number of grid points.

  • Composition profiles are now visualised before you plot the results. A useful tool tip explains how each one works and how to set them, as shown below.
Diffusion-module-Composition-profiles

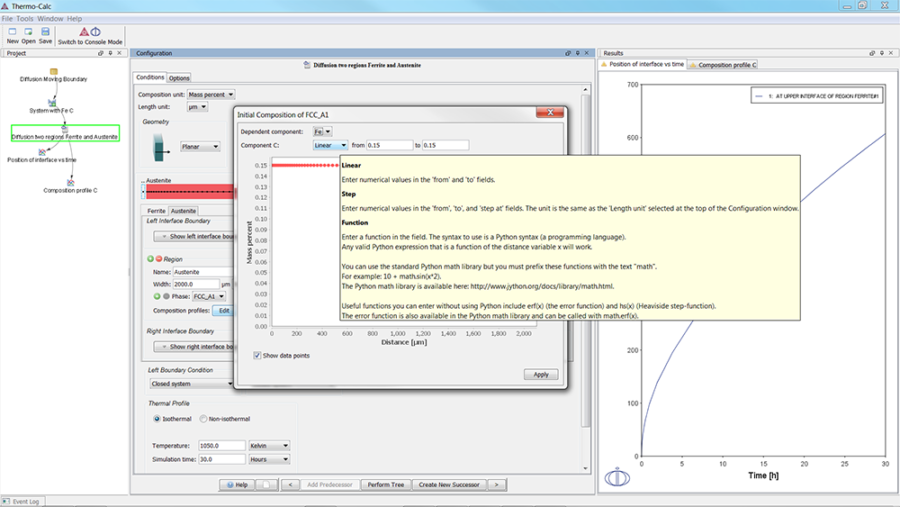
Composition profiles are now visualised before you plot the results and a tool tip helps users set the composition profile.

  • User defined functions (using Python) can be added in the new composition profiles feature, allowing you to see if there are any mistakes before you plot the results.
  • Three new examples are included to help users learn about the new features: D_05, D_06 and D_07. All Diffusion module examples can be found in the software in the Help Menu > Open Examples > Diffusion Module – DICTRA.
  • A video for example D_07 showcases the new features.

New Features in the Precipitation Module (TC-PRISMA)

The Precipitation Module (TC-PRISMA) has received several new features in Thermo-Calc 2017b.

  • Elastic strain energy effect on precipitation can now be taken into account, as shown in the image below. Default values will be offered for each type of alloy or users can provide their own data. An elastically homogeneous system is assumed.
  • Non-spherical morphology of precipitate particles can be treated. If desired, the evolution of the shape factors for cuboids, plates or needles can be predicted together with the size, as shown in the image below. This new feature is explained in a new video for example P_09.
Precipitation-module-Morphology

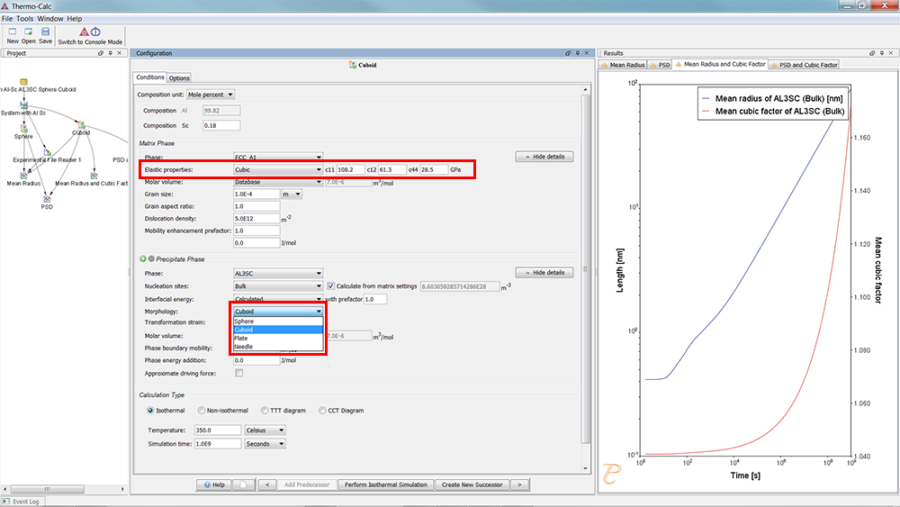
The Precipitation Module (TC-PRISMA) can now take elastic strain energy into account. Non-spherical morphology of precipitate particles can now also be treated.

  • A bug that sometimes led to a sudden stop of a simulation because of the “negative matrix composition” error has been fixed.
  • A new calculation type, CCT or Continuous Cooling Transformation, has been added to the software, as shown in the image below. The new calculation type is explained in a new video for example P_07.
CCT-diagram-thermo-calc-2017b

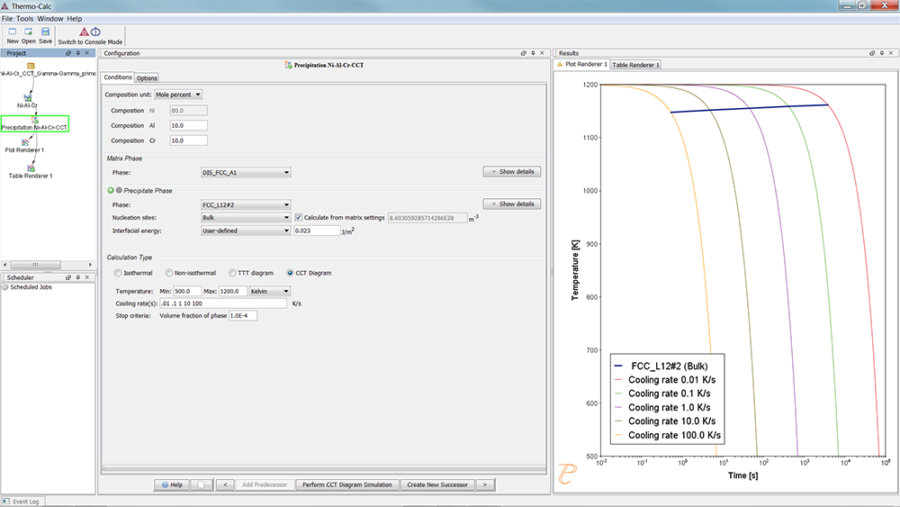
A CCT diagram calculated in the Precipitation Module (TC-PRISMA) using example P-7. The CCT calculation type was added to Thermo-Calc in the 2017b release and allows users to make calculations for Continuous Cooling Transformation.

  • Three new examples are included to help users learn about the new features: P_07, P_08 and P_09. All Precipitation module examples can be found in the software in the Help Menu > Open Examples > Precipitation Module – TC-PRISMA.

3D Plotting

Thermo-Calc 2017b includes 3D plotting for Grid calculations in the Property Model Calculator and the Equilibrium calculator. See example T_11_Coarsening_and_Interfacial_energy or the accompanying PM_G2 tutorial video (the example has been renamed”PM_G2_Coarsening_and_Interfacial_energy”).

Thermo-Calc-3D-plot_solidus-and-liquidus

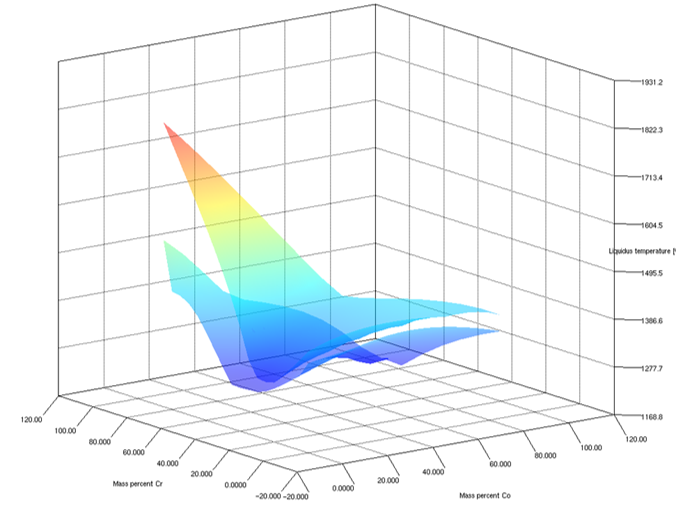
A 3D plot of the solidus and liquidus temperature for a 6 component Ni alloy made with the new 3D plotting feature in Thermo-Calc.

Improvements to the Scheil Calculator

The Scheil Calculator has been updated to be faster and more reliable. The improved Scheil calculator has better handling of multiple composition sets and no longer resets if a new composition set is found. Additionally, it now automatically changes numerical settings if needed.

Usability Improvements and Bug Fixes

  • Users can now enter custom contour values in contour plots.
Custom-Contour-Values_03

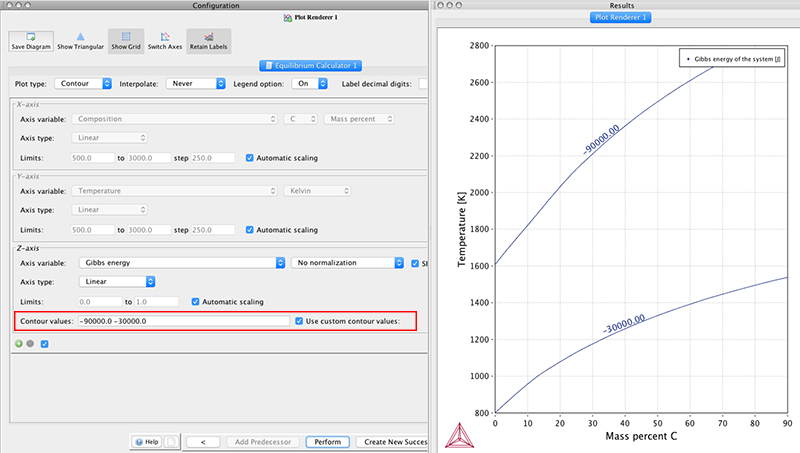
Users can now add their own custom contour values to contour plots. The program auto-adjusts the scaling on the plot to show the custom values.

  • Using the tab key to jump to a text box now auto-selects all text in the box.
  • The periodic table has higher contrast colours for selected/deselected elements.v
  • A bug was fixed that caused the graphical mode of Thermo-Calc to scale oddly on high resolution screens.
  • Many other bug fixes

Let Us Help You

Is Thermo-Calc Right for You?

Talk to one of our experts to learn whether our tools fit your needs.